-
FAQs
-
Sysrisk User Manual
-
- Step-by-Step Guide to SysRisk Purchasing Process
- Team or Enterprise License Purchase: Login and Profile Setting Process
- Password Management Process
- Company Profile in SysRisk
- User Creation and Role Assignment in SysRisk
- Customization and Dashboard Configuration
- Homepage Overview
- SysRisk Activity Logs
- Category Management for ERM
- Risk Approval Overview1
- Risk Entry Page for ERM
- Risk Entry Page for PRM
- Creating AI-Generated Risk Entries in SysRisk
- Risk Register Risk Prioritization Page Overview
- Risk Creation, Edit and Approval Process in SysRisk
- Risk Closure Process in SysRisk
- SysRisk Auditing Record Maintenance
- Risk Notification Settings
- Show Remaining Articles (3) Collapse Articles
-
-
Risk Management
-
- Control Risk
- ERM
- Inherent Risk
- Qualitative Risk Analysis
- Quantitative Risk Analysis
- Residual Risk
- Risk Acceptance
- Risk Acceptance Criteria
- Risk Aggregation
- Risk Analysis
- Risk Analysis Methods
- Risk Analytics
- Risk Appetite
- Risk Appetite Framework
- Risk Appetite Statement
- Risk Assessment
- Risk Assessment Matrix
- Risk Assessment Process
- Risk Attribution
- Risk Avoidance
- Risk Bearing Capacity
- Risk Benchmarking
- Risk Capacity
- Risk Capital
- Risk Clustering
- Risk Communication
- Risk Communication Plan
- Risk Concentration
- Risk Contingency
- Risk Contingency Plan
- Risk Control
- Risk Convergence
- Risk Criteria
- Risk Culture
- Risk Dashboard
- Risk Dependency
- Risk Diversification
- Risk Escalation
- Risk Escalation Path
- Risk Evaluation
- Risk Exposure
- Risk Financing
- Risk Framework
- Risk Governance
- Risk Heat Map
- Risk Horizon
- Risk Identification
- Risk Indicator
- Risk Intelligence
- Risk Interdependency
- Risk Inventory
- Risk Landscape
- Risk Management(RM)
- Risk Management Dashboard
- Risk Management Framework
- Risk Management Maturity
- Risk Management Plan
- Risk Management Policy
- Risk Mapping
- Risk Matrix
- Risk Maturity
- Risk Mitigation
- Risk Mitigation Plan
- Risk Mitigation Strategy
- Risk Model
- Risk Monitoring
- Risk Optimization
- Risk Owner
- Risk Ownership
- Risk Policy
- Risk Portfolio
- Risk Prioritization
- Risk Profile
- Risk Quantification
- Risk Reduction
- Risk Register
- Risk Register Update
- Risk Reporting
- Risk Resilience
- Risk Response
- Risk Response Plan
- Risk Review
- Risk Review Process
- Risk Scenario
- Risk Scenario Analysis
- Risk Scenario Planning
- Risk Scoring
- Risk Sensing
- Risk Sharing
- Risk Strategy
- Risk Taxonomy
- Risk Threshold
- Risk Tolerance
- Risk Tolerance Level
- Risk Transfer
- Risk Transparency
- Risk-Adjusted Return
- Show Remaining Articles (82) Collapse Articles
-
- Business Continuity Risk
- Capital Risk
- Competition Risk
- Compliance Risk
- Counterparty Risk
- Credit Risk
- Credit Spread Risk
- Currency Risk
- Cybersecurity Risk
- Deflation Risk
- Environmental Risk
- Ethical Risk
- Event Risk
- Financial Risk
- Foreign Exchange Risk
- Fraud Risk
- Geopolitical Risk
- Health and Safety Risk
- Human Capital Risk
- Inflation Risk
- Infrastructure Risk
- Innovation Risk
- Insurance Risk
- Intellectual Property Risk
- Interest Rate Risk
- Legal Risk
- Liquidity Risk
- Market Risk
- Model Risk
- Natural Disaster Risk
- Operational Risk
- Outsourcing Risk
- Political Risk
- Product Liability Risk
- Project Risk
- Regulatory Change Risk
- Regulatory Risk
- Reputation Risk
- Reputational Risk
- Resource Risk
- Sovereign Risk
- Strategic Alliance Risk
- Strategic Risk
- Supply Chain Risk
- Sustainability Risk
- Systemic Risk
- Technological Risk
- Technology Risk
- Show Remaining Articles (33) Collapse Articles
-
The Homepage serves as the central hub for monitoring and managing Enterprise risk data. It provides a quick and efficient overview of all risk management activities across the system, offering intuitive access to key metrics and insights. Users can quickly drill down into specific risk details by interacting with the various General Information Tiles and Risk Event Tiles on the page. Below is an enhanced breakdown of the homepage features, emphasizing user interactions and workflows.
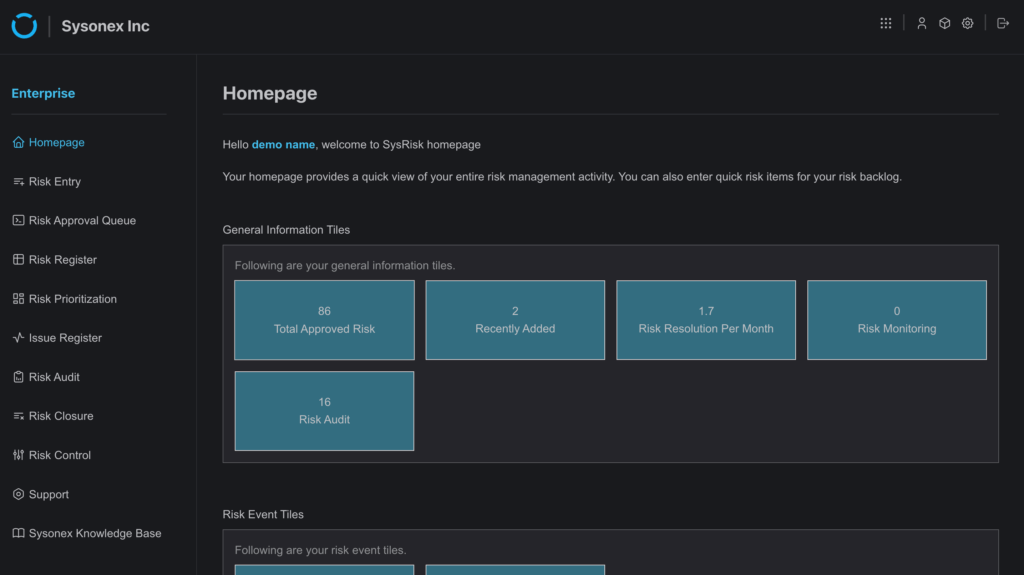
1.1 General Information Tiles
These tiles give high-level insights into the system’s risk performance. Clicking on any tile opens detailed data views with options to filter and explore specific items further.
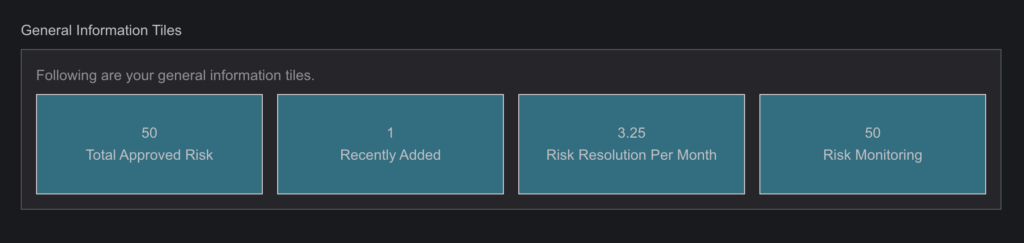
Total Approved Risk
Description: Displays the total number of risks that have successfully passed the approval process for the Admin. For general users, it shows only the number of approved risks in which the user is directly involved.
Functionality: Click to navigate to a detailed list of all approved risks. Users can further filter these risks by Unique ID, Title or Status.
Use Case: Enables users to quickly access risks that are approved and actively being monitored or mitigated.
Recently Added Risks
Description: Shows the number of approved risks added to the system in the past few days.
Functionality: Clicking the tile displays a table of recently added risks, along with their status, owner, and title.
Use Case: Ideal for product admins or admins who want to monitor new risks as they are reported in real-time.
Risk Resolution per Month
Description: Displays the rate of risks being resolved month-over-month (individual progress for general users).
Functionality: This tile is not dynamic. It shows static analysed numerical value of risk resolution per month.
Use Case: Useful to track how efficiently the team is mitigating risks over time.
Risk Monitoring
Description: Shows the total number of risks currently under monitoring of the user.
Functionality: Clicking on this tile presents a list of risks marked for continuous tracking by the user. The list includes users involved in the risk and additional information.
Use Case: Helps users to keep track of the risk items they are entitled to monitor.
1.2 Risk Event Tiles
The Risk Event Tiles provide a summarized view of all major events related to risk management. These tiles allow users to quickly access risk and issue data and take further action.
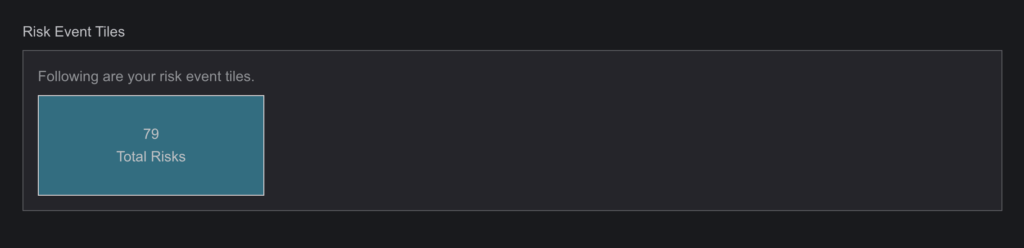
Total Risks
Description: The total number of risks logged in the system. For general users, it shows only the number of risks in which the user is directly involved or created.
Functionality: Clicking the tile opens a detailed list of all risks(with and without unique ID), including their risk scores, lifecycle status, and associated projects. Users can filter or sort the list by status, title or ID.
Use Case: Enables risk managers to keep track of every risk that has been entered into the system.
1.3 Approval Status
The Approval Status section allows users to view and manage risk items based on their current approval stage.
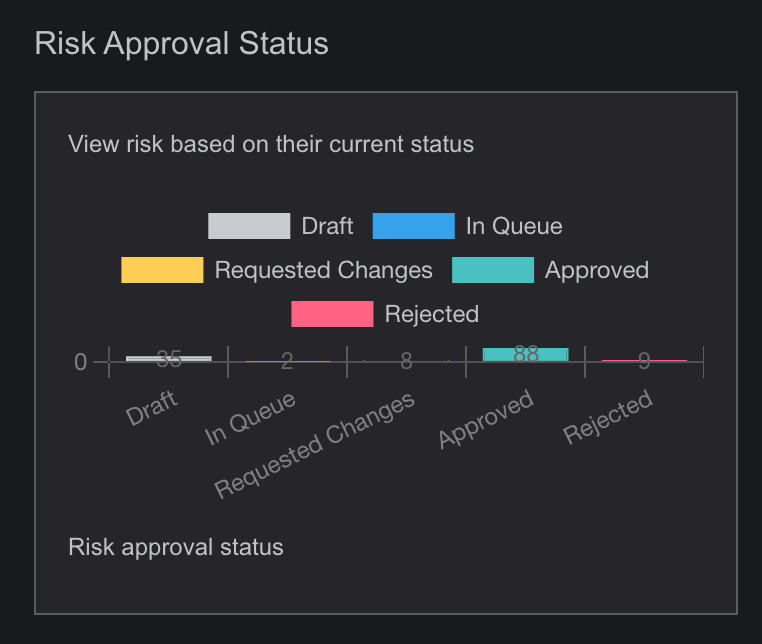
Description: Displays the approval workflow status of all risks, including items that are pending approval(Draft, In Queue), under review(Requested Changes, Rejected) or already approved.
Functionality: Clicking this section provides a detailed list of risks filtered by approval status. Users can approve or reject risks directly from this view or request further details from risk owners.
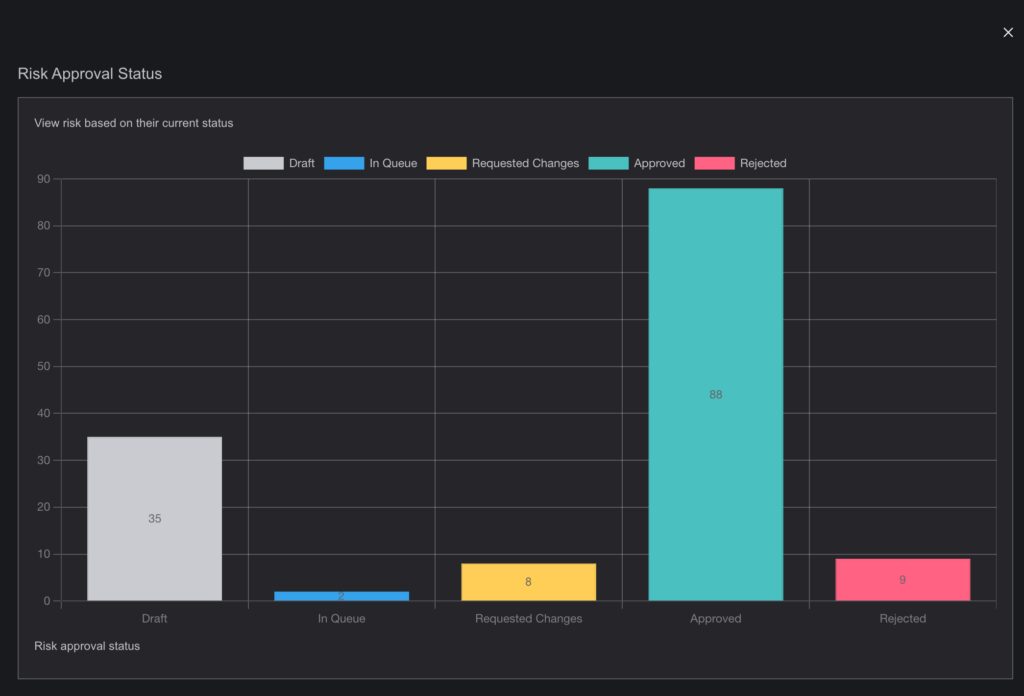
Use Case: Facilitates efficient approval management, particularly for team leaders or administrators overseeing multiple risk submissions.
1.4 Risk Growth
The Risk Growth section provides a visualization of risk growth over time.
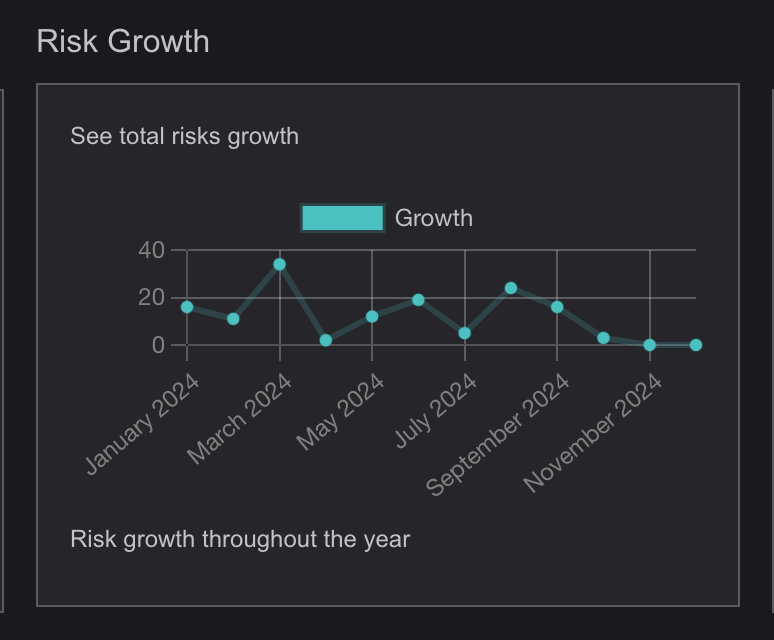
Description: Displays a trend graph that tracks the growth of total risks throughout the year.
Functionality: Clicking this graph reveals detailed historical data on the addition of risks across various projects and categories.
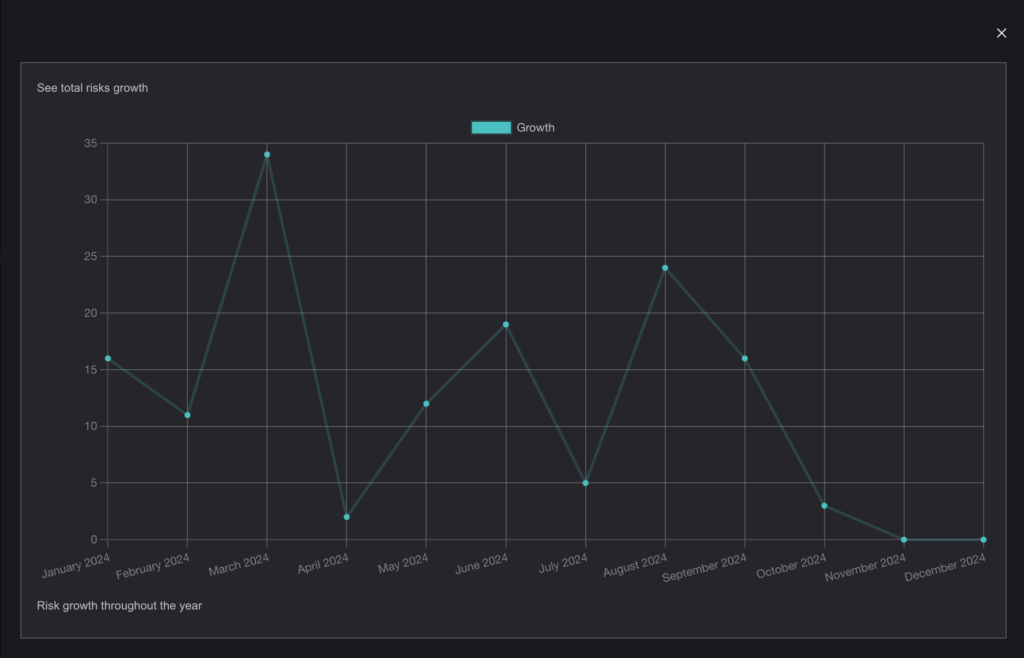
Use Case: Useful for analysing risk trends over time, allowing risk managers to forecast potential risk spikes or identify months where risks are more likely to occur.
1.5 Risk Status Overview
The Risk Status Bar Chart section provides a visual representation of risks categorized by their current status.
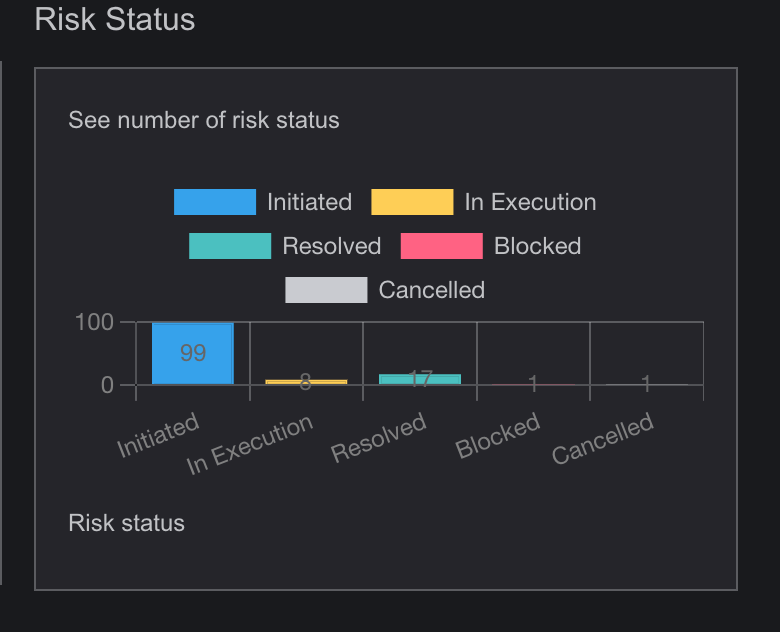
Description: Displays a bar chart that visualizes risk items based on their status—initiated, in execution, resolved, blocked, or cancelled.
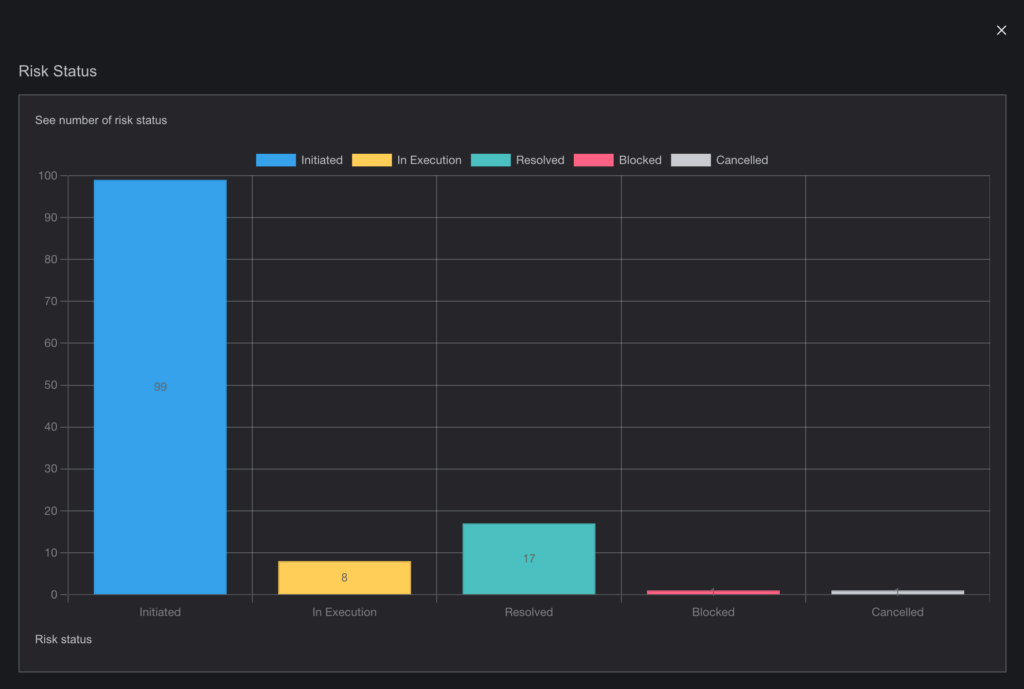
Functionality: Clicking on the chart reveals numeric information on risks under specific status.
Use Case: Useful for tracking the distribution of risks by status, enabling stakeholders to monitor progress, address roadblocks, and assess how many risks have been resolved or remain active.
1.6 Risk Overview Pie Charts
The Risk Overview Pie Charts section provides a visual breakdown of risks based on their approval status, risk status, and category.
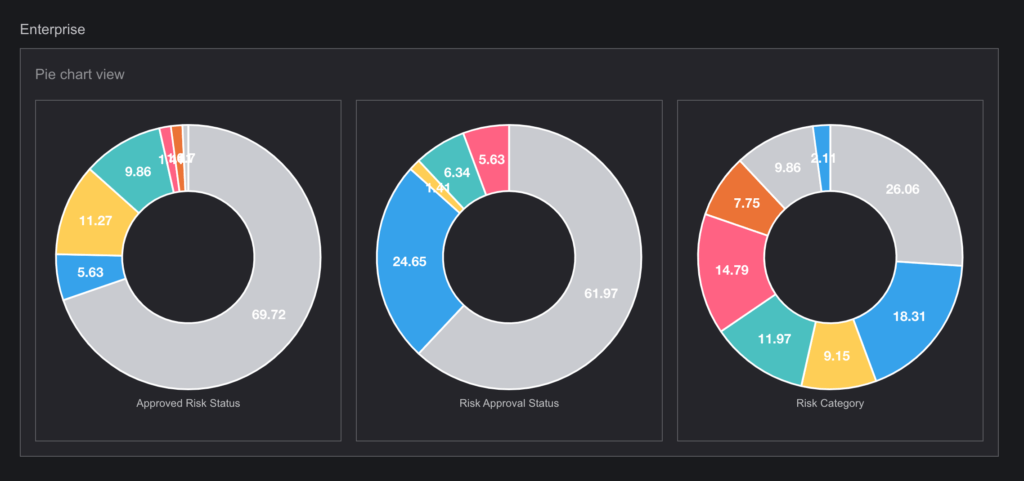
Description: Displays three pie charts:
- one showing the distribution of risks by approval status,
- second illustrating the distribution by risk status (e.g., approved, rejected),
- third chart displaying the breakdown by risk categories.
Functionality: Clicking on any segment of the pie charts reveals detailed data associated with that specific status or category, including risk counts and related categories.
Use Case: Useful for quickly understanding the overall composition of risks, allowing users to assess risk approval ratios, identify trends in risk statuses, and see which categories contribute the most to the total risk profile.
1.7 Efficient Data Drill-Down
All tiles on the homepage are interactive and designed for efficient navigation. Users can click on any data point to drill down into the specific details, filter results, and perform actions, such as:
- Viewing risk details
- Approving or rejecting risks
- Monitoring progress or status
- Accessing audit trails
By providing a seamless way to navigate between summary data and detailed views, the homepage acts as the control centre for risk management activities.
1.8 Customizable Dashboard
Users with administrative privileges can customize the homepage layout by:
Adding or removing tiles based on their role (e.g., Admin, General User etc).
Modifying the types of risks displayed. Customizing visualizations for better understanding and prioritization of risks (e.g., adjusting thresholds in the heatmap or scatter plot).